The Next Ten Years in Emerging Markets


Emerging markets have come out of a period of considerable underperformance relative to both the U.S. market and international developed markets. They have now outperformed for over two years, recovering some lost ground.

Valuations in emerging markets remain in line with historical norms, which is an aberration in a world of generally extreme asset prices. Strangely, while a very large growth premium is paid for growth assets in the U.S. market, that view has not benefited emerging markets, even though on average they have much higher GDP growth than developed markets.

EM’s poor performance over the past decade can largely be attributed to multiple contraction (The Past Ten Years in Emerging Markets). The graph below shows the evolution of the cyclically adjusted price to earnings (CAPE) ratio over this period. The average historical CAPE ratio for EM has been 14.4, which is exactly in line with the current level. After peaking in 2007, the CAPE for EM bottomed out in 2011-2013, at 10 times trailing earnings. We have already seen considerable multiple expansion since then, a consequence of the past two years of strong performance. Nevertheless, we can expect that, as always, valuations will peak this cycle well above the historical average, so additional multiple expansion is likely.

On a country-by-country basis, however, greater opportunities exist, and the investor can weigh his allocations accordingly.  The chart below shows how valuations have evolved over the past ten years for the primary EM countries. The first two columns on the left show the CAPE ratios at year-end 2007 and 2017, respectively. While the U.S. saw multiple expansion, every EM country saw multiple contraction over this period.  The next to last column on the right shows the country’s average CAPE for the past twenty years, and the last column shows how far the 2017 ratio is above or below the average.

Several conclusions can be drawn from this table.

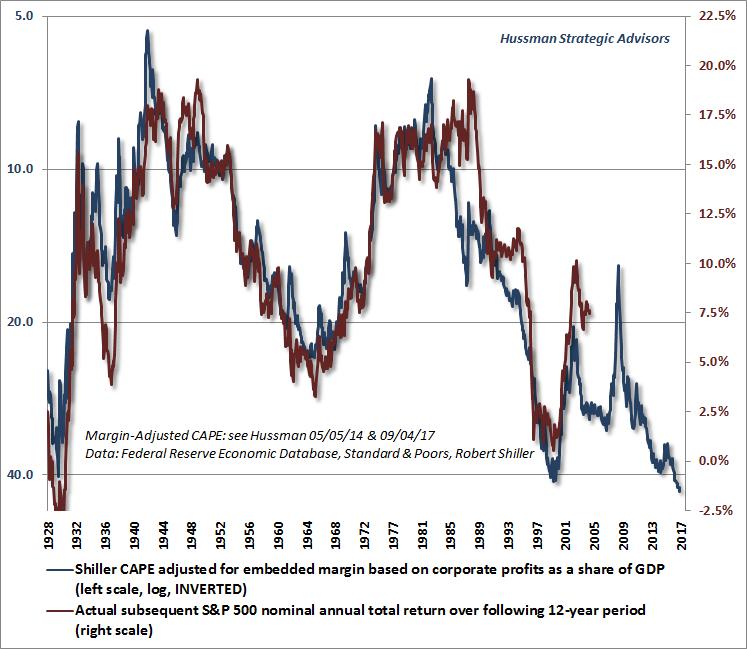
  • The U.S market is priced for perfection, and should be expected to provide very low returns for the next 7-10 years.
  • “Risky” countries (commodity producers and those dependent on erratic foreign flows) offer significant upside to get back to average valuations. These “boom-to-bust” markets now stand to benefit from late-cycle effects of the U.S. economy, the weak dollar and strengthening commodity prices and will eventually trade at multiples above the historical average. This means high potential upside for stock prices in Russia, Brazil, Turkey, Malaysia , Chile and Colombia.
  • Mexico has been overly punished because of concerns with President Trump and the 2018 presidential election, and it could rebound strongly.
  • Indonesia and India are near normal valuations, and will need strong earnings growth and higher multiples to continue to outperform.
  • Philippines is at a very high level of valuation. This “FIRE” (finance-insurance-real estate) economy/market has benefited from liquidity and low interest rates, as these activities are all highly leveraged. Of course, the opposite will occur on the downside.

Valuations, in general, and CAPE in particular, are not good timing tools. However, historical observation and the academic research done by Professor Robert Shiller and others show a high correlation between CAPE and future returns. In EM, investors are fickle and nervous and things tend to happen quicker than in developed markets, so CAPE is probably a good allocation tool for 3-5 year investment cycles.

India Watch:

China Watch:

  • Couples not delivering on babies (Caixing)
  • The world’s most valuable luxury good company (WIC)
  • Making China Great Again (The New Yorker)

China Technology Watch:

  • China now top producer of scientific articles (Nature)
  • Tencent’s Wechat: an app and an app-store  at the same time (SCMP)
  • China to test new Maglev train (Caixing)
  • JD’s Liu goes to Davos (SCMP
  • Smartphone sales fall in China for the first time (SCMP)
  • Xiaomi gains top smartphone spot in India (SCMP)EM Investor Watch:

Technology Watch:

  • Amazon’s new Go store (Stratechery)
  • Renewable power costs in 2017 (Irena)
  • Apple’s share of smartphone profits is falling (SCMP)

Investor Watch:


The Past Ten Years in Emerging Markets


Ben Carslon ( Wealth of Common Sense blog) every year publishes a chart reviewing the performance of 10 asset classes over the past decade. It is a good reminder of how erratic annual returns can be. As shown in the chart below, even though emerging markets performed very poorly over the decade, the asset class was the best performer in three of the years and in the top half of the chart 50% of the time. Commodities were the worst performing asset class, which partially explains weak EM. This chart is U.S.-centric and expressed in US dollar terms, so the strength of the USD  over the period goes a long way to explaining the weak results for EM, commodities and international stocks.

A similar review of emerging markets organized by country is shown below. The returns are not strictly comparable to the previous chart, as these do not include dividends as part of the return. As in the previous chart, the annual returns are erratic and highly unpredictable. However, over the 10-year period, which is long enough to represent two normal 5-year investment cycles or a long 10-year cycle, the results are much less arbitrary.

Valuations do Matter

Though over the short-term valuations are a poor timing instrument, over ten-year periods they are very effective allocation tools. Looking at the Cyclically Adjusted Price Earnings Ratio (CAPE), which averages  inflation-adjusted earnings over the ten-year period, we can see that much of the performance differences can be attributed to the starting and ending points of valuations. The CAPE ratios for 2007 and 2017 are shown below. It must be noted that 2007 ended with very high valuations in most emerging markets, as this was the peak of U.S. Fed-induced “easy money” and commodity prices.

In  our sample, only the USA  (S&P 500) had an expansion in its CAPE ratio, and this explains almost all of its absolute and relative returns for the period. The best performing emerging market, Thailand, had a flat CAPE ratio, while every other market had a contraction in its CAPE ratio. The better performers had smaller contractions in their ratios, with the exception of Indonesia. The worst performers – Russia, Brazil, Turkey, Malaysia — had huge contractions in their CAPE ratios. Though India experienced a period of very high GDP growth and political stability, it could not overcome the anchor from its extreme valuations at the start of the period.

Commodities and Currencies Matter in Emerging Markets

The past ten years was a period of dollar strength and commodity weakness, both of which are correlated to poor performance for the EM asset class. With the exceptions of Indonesia, Peru and South Africa, all commodity-sensitive countries did poorly. Indonesia and Peru were supported by the large size of financials in their indexes, and South Africa is an anomaly because its market has become more correlated to China technology (Naspers-Tencent) than to the domestic economy.

And so do Politics and Governance

Russia, Brazil and Turkey all suffered from severe political instability during the period. Russia’s war with Ukraine and the following economic sanctions, Erdogan’s radicalization of Turkish politics, and Brazil’s economic mismanagement and corruption scandals, were all self-inflicted disasters that could not have been anticipated at the end of 2007.


Fed Watch:

India Watch:

China Watch:

  • The world’s most valuable luxury good company (WIC)
  • US politics gets in the way of Ant Financial’s US plans (SCMP)
  • Making China Great Again (The New Yorker)

China Technology Watch:

  • Chinese tech workers are flocking home  (Bloomberg)
  • How China went from made in to created in (SCMP)

EM Investor Watch:


  • Venezuela’s oil production collapse (Bloomberg)
  • World Economic Forum, Manufacturing Report, 2018 (WEF)
  • Pakistan ditches the dollar for China trade (CNBC)

Technology Watch:

  • Renewable power costs in 2017 (Irena)
  • Apple’s share of smartphone profits is falling (SCMP)

Investor Watch:

Valuations in Emerging Markets

Valuation of equities is a relatively simple matter, as long as one is disposed to believe that prices fluctuate as a function of the “greed-fear” cycle of investors but eventually mean-revert to historical parameters. However, over the short-term, the forward-looking period of 3-12 months of almost exclusive concern to Wall Street, the media and the majority of investors, valuation parameters can seem largely irrelevant, as it is difficult to predict when trends will change or what may trigger a drawdown. Typically, market corrections are caused by economic recessions, which bring stocks back to lower levels and create opportunities for investors to buy equities with prospects for reasonable returns.

Having said that, there are two reasons for believing that valuations may be drifting higher with time, which would require long-term forecasters to make some adjustments to their models. First, there is no doubt that the cost of buying and holding equities has fallen dramatically over time. For example, I remember buying the closed-end , NYSE-traded The Mexico Fund in the mid-1990s. Trading commissions were in the order of ten times the $5/trade many brokers charge today, the fund manager charged a management fee well above 2% for what was essentially an index fund. To top it off, the fund traded at very large discounts to Net Asset Value, sometimes as great as 30%. Compare that to the emerging market country funds now trading in ETF form with annual fees of as low as 14 basis points (0.14%), and it is clear that investing in emerging market equities, as in other asset classes, has never been cheaper than today. It would make sense that valuations would at least partially reflect the lower transaction costs.

Another often-cited, though less plausible, explanation for higher valuations is that risk has been permanently reduced by lower economic volatility. This theory was advanced as a possibility already in the late 1950s by no less than the legendary investor and teacher Ben Graham, who was searching for a reason to explain why U.S. stocks had appreciated so much during the post-war period. If one believes Ben Bernanke’s theory that improvements in the science of monetary economics has resulted in a “great moderation,” or smoothing of economic cycles, than this could point to higher-for-ever valuations. Of course, one would have to explain the Great Financial Crisis of 2008-2009 as a “Five Sigma” event not likely to happen for another thousand years. This is the view that has been publicly expressed rather unconvincingly, in my view, by Bernanke and Janet Yellen, and which justifies the extremely low volatility and high valuations of the current investment environment.

What does history tell us about current valuations? The work of GMO, Research Affiliates, and Haussman all agree that most assets priced at levels that point to very low expected returns for most asset classes.

First, let’s look at the work of John Hussman (Hussman Funds), which back-tests historical data to forecast future returns. Hussman’s model predicts negative 2% nominal (including inflation) returns for the next 12 years.

Second, let’s look at GMO, which has made these forecasts for decade with a high degree of predictive success. The table below shows GMO 7-year forecast for real (inflation-adjusted) returns. GMO sees negative returns for stocks, partuclarly U.S. large cap stocks with negative 4.6% annual real returns (in line with Hussman’s number). Emerging markets stocks are the exception,  priced to give a 2.2% real annual return. Jeremy Grantham, GMO Chief Strategist, recently advised his clients to load-up as much as they can on emerging market equities.

Third, we look at Research Affiliates, with the results of their latest exercise below. RA forecasts real returns and volatility for the next ten years. RA’s model points to generally higher returns for all asset classes compared to GMO’s, but still U.S. equities are expected to provide near zero return for the period. International returns (EAFE, Europe, Asia, ar-East) are slated at slightly above 4%, and emerging markets are expected to provide real returns of 6% per year.

These three approaches point to relatively high expected returns for emerging markets. These can be explained by three factors: 1.relative under-performance over the past five years; 2.Valuations in line with history, and quite low relative to U.S. equities; 3. the earnings cycle; and 4. the currency cycle.

  1. Relative Underperformance (S&P 500 vs. MSCI Emerging Markets Index)

  1. Valuations (Cyclically Adjusted PE ratio), S&P500 vs. EM

3.Earnings are on the rebound in EM.

4.Competitive Currencies

Fed Watch:

India Watch:

China Watch:

  • US politics gets in the way of Ant Financial’s US plans (SCMP)
  • Making China Great Again (The New Yorker)

China Technology Watch:


EM Investor Watch:


Technology Watch:

  • Apple’s share of smartphone profits is falling (SCMP)
  • Fanuc’s robots are changing the world (Bloomberg)
  • Battery costs coming down (Bloomberg)

Investor Watch:


“The central truth of the investment business is that investment behavior is driven by career risk. In the professional investment business we are all agents, managing other peoples’ money. The prime directive, as Keynes knew so well, is first and last to keep your job. To do this, he explained that you must never, ever be wrong on your own. To prevent this calamity, professional investors pay ruthless attention to what other investors in general are doing. The great majority ‘go with the flow,’ either completely or partially. This creates herding, or momentum, which drives prices far above or far below fair price. There are many other inefficiencies in market pricing, but this is by far the largest. It explains the discrepancy between a remarkably volatile stock market and a remarkably stable GDP growth, together with an equally stable growth in ‘fair value’ for the stock market.”  ~ Jeremy Grantham

India, Urbanization and a New Commodity Bull Market

Around the turn of the century, China’s economy entered in a phase of very high growth which was fueled by investments in infrastructure and heavy industry and was extremely intensive in the use of hard commodities. A surge of demand from China caught producers by surprise and drove prices  for commodities, such as iron ore and copper, to very high levels for an extended period of time (2003-2011).  A typical boom-to-bust cycle ensued, with overinvestment by producers eventually resulting in over-capacity and a return to low prices.

Commodity markets have been depressed for the past five years and valuations for the stocks of the producer firms have reached record lows relative to stocks in other sectors.

China’s impact on commodity prices, though extraordinary, was not atypical. Historically, countries have entered periods of commodity-intensive growth when they reach a certain level of wealth and experience high urbanization rates: for example, the U.S. in the 1920s, Japan in the 1950s, Brazil in the 1960s and Korea in the 1970s. All these countries saw a period of massive growth in commodity consumption, which eventually leveled off. U.S steel consumption today is at the same level as in 1950, while the Japanese consume steel at 1975 levels.

We can see in the following chart the recurring pattern, when countries suddenly ramp up urbanization rates. High income nations have largely stabilized urbanization levels, while China, India and  all lower-income developing countries still have several decades ahead.


If we can identify the next countries experiencing high growth and urbanization, we can go a long way towards understanding the next upcycle in commodities. From looking at historical data, it is the case that urbanization rates ramp up when countries reach a level of wealth around $2,000 per capita (2016, constant USD). The table below shows the progression by decade of new countries entering this wealth level, according to IMF and World Bank data. During the decade ending in 1980, Korea, Poland and Thailand entered into this group; none entered in the 1980s; Russia (and other Eastern European state) appear in the 1990s; and China, Nigeria, Ukraine and Indonesia enter in the 2000s. In this current decade only Vietnam has appeared, so far; but if we look through 2022, we see a massive swell led by India but also including Uzbekistan, Myanmar and Kenya.

It is not the number of countries that matter, of course, but rather the population impact that they represent. The chart below shows the population impact by period, in terms of new entrants as a percentage of global population. We can see a huge surge representing 21.8% of the global population (23%, including Vietnam), surpassed only by the China-led surge of the 2000s.

Equally important, the upcoming surge will happen at a time when China sustains relatively high growth and increasing urbanization, so that we will have both China and India sustaining demand at the same time.

A new upcycle in commodity prices is obviously bullish for emerging market producers, such as Chile, Brazil, Indonesia, Russia and South Africa. It also likely points to a weak dollar and good performance for emerging market stocks in general.

Fed Watch:

India Watch:

China Watch:


  • US politics gets in the way of Ant Financial’s US plans (SCMP)
  • Making China Great Again (The New Yorker)
  • Geely invests in AB Volvo trucks (SCMP)
  • China’s commodity demand (Treasury)
  • Ground broken on China-Thai railroad (Caixing)

China Technology Watch:

EM Investor Watch:


  • France seeks closer ties with Russia and China (WSJ)
  • Latin America’s rejection of the left (Project Syndicate)
  • Indonesia’s bullet-train project stalls (Asia Times)
  • Boeing’s bid for Embraer (Bloomberg)

Technology Watch:

  • Apple’s share of smartphone profits is falling (SCMP)
  • Fanuc’s robots are changing the world (Bloomberg)
  • Battery costs coming down (Bloomberg)

Investor Watch: